Abstract
Various adaptation methods, such as LoRA, prompts, and adapters, have been proposed to enhance the performance of pre-trained vision-language models in specific domains. As test samples in real-world applications usually differ from adaptation data, the robustness of these adaptation methods against distribution shifts are essential. In this study, we assess the robustness of 11 widely-used adaptation methods across 4 vision-language datasets under multimodal corruptions. Concretely, we introduce 7 benchmark datasets , including 96 visual and 87 textual corruptions , to investigate the robustness of different adaptation methods, the impact of available adaptation examples, and the influence of trainable parameter size during adaptation. Our analysis reveals that: 1) Adaptation methods are more sensitive to text corruptions than visual corruptions. 2) Full fine-tuning does not consistently provide the highest robustness; instead, adapters can achieve better robustness with comparable clean performance. 3) Contrary to expectations, our findings indicate that increasing the number of adaptation data and parameters does not guarantee enhanced robustness; instead, it results in even lower robustness. We hope this study could benefit future research in the development of robust multimodal adaptation methods.
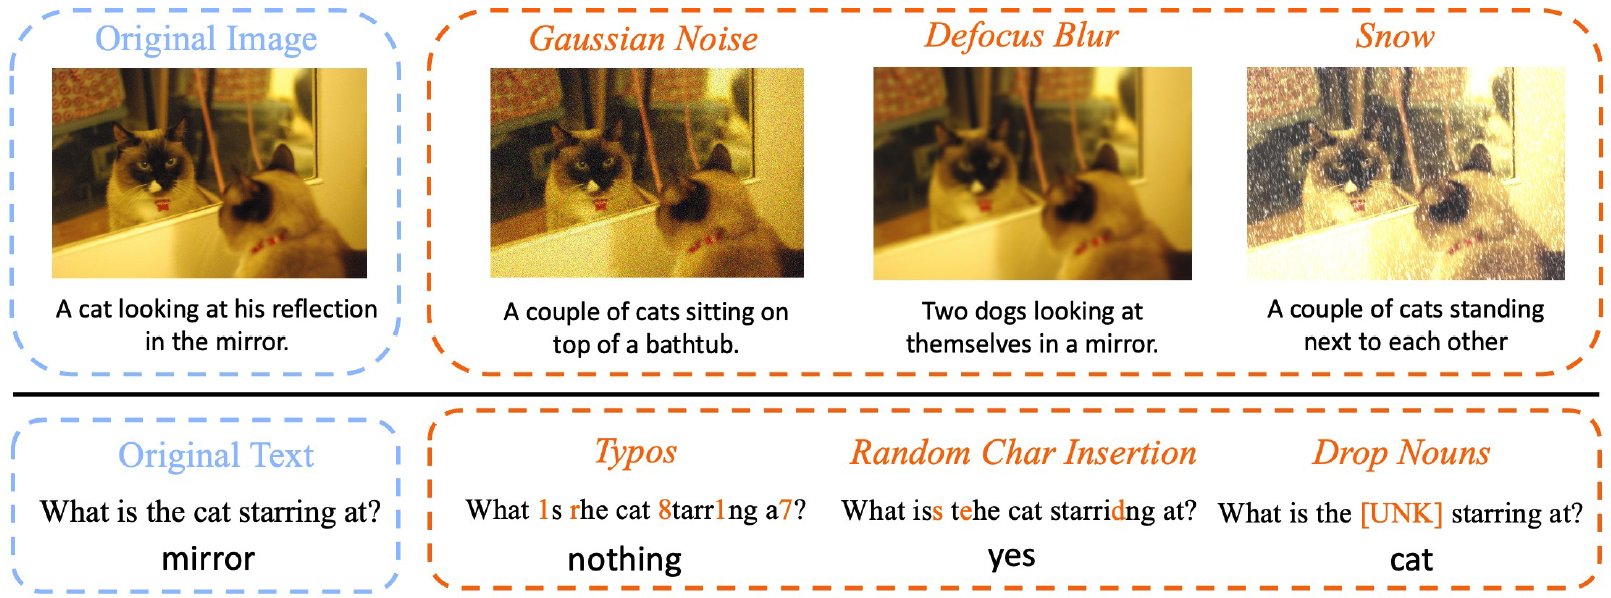
Multimodal adaptation methods are sensitive to image and text corruptions. The two rows show image captioning and visual question answering predicted by Adapter respectively. Blue boxes contain the original image and query text. Orange boxes present the corrupted images, texts and model output.
Model Adaptation Methods
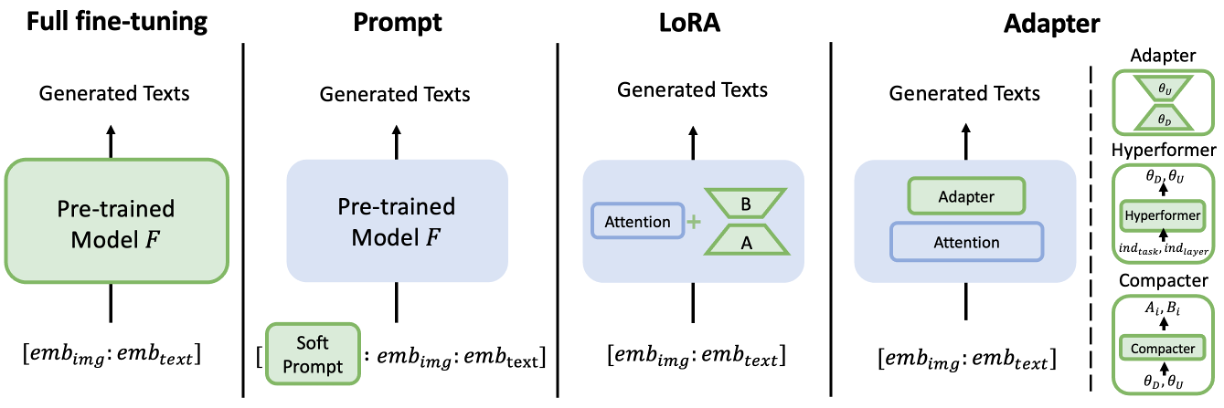
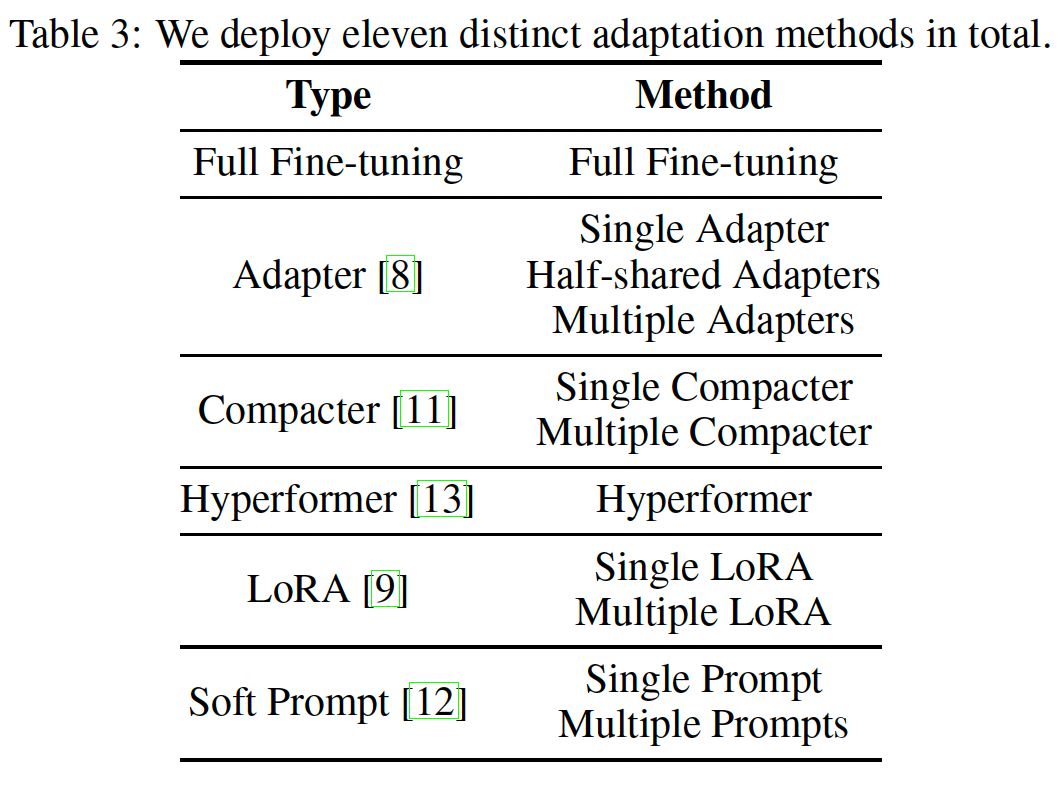
We investigate the robustness of four mainstream adaptation methods: full fine-tuning, soft prompt, LoRA, and adapter-based methods including Adapter , Hyperformer, and Compacter. To better understand the robustness of these adaptation methods, we also consider the information sharing across tasks. Therefore, for soft prompt, LoRA, and Compacters, we conduct experiments in both single and multiple manners. The single manner uses one adaptation model for all tasks, while the multiple manner uses independent adaptation modules for different tasks. For Adapter, besides the single and multiple manners, we also adopt the half-shared manner, where only the undersampling module in adapters is shared across tasks. In total, we have eleven adaptation methods
Benchmark and Evaluations

Examples of image and text corruptions. The top row shows an original image from GQA and images corrupted by zoom blur with 5 levels of severity. The second row presents text corruptions on the original texts where red sign indicates the corrupted parts.
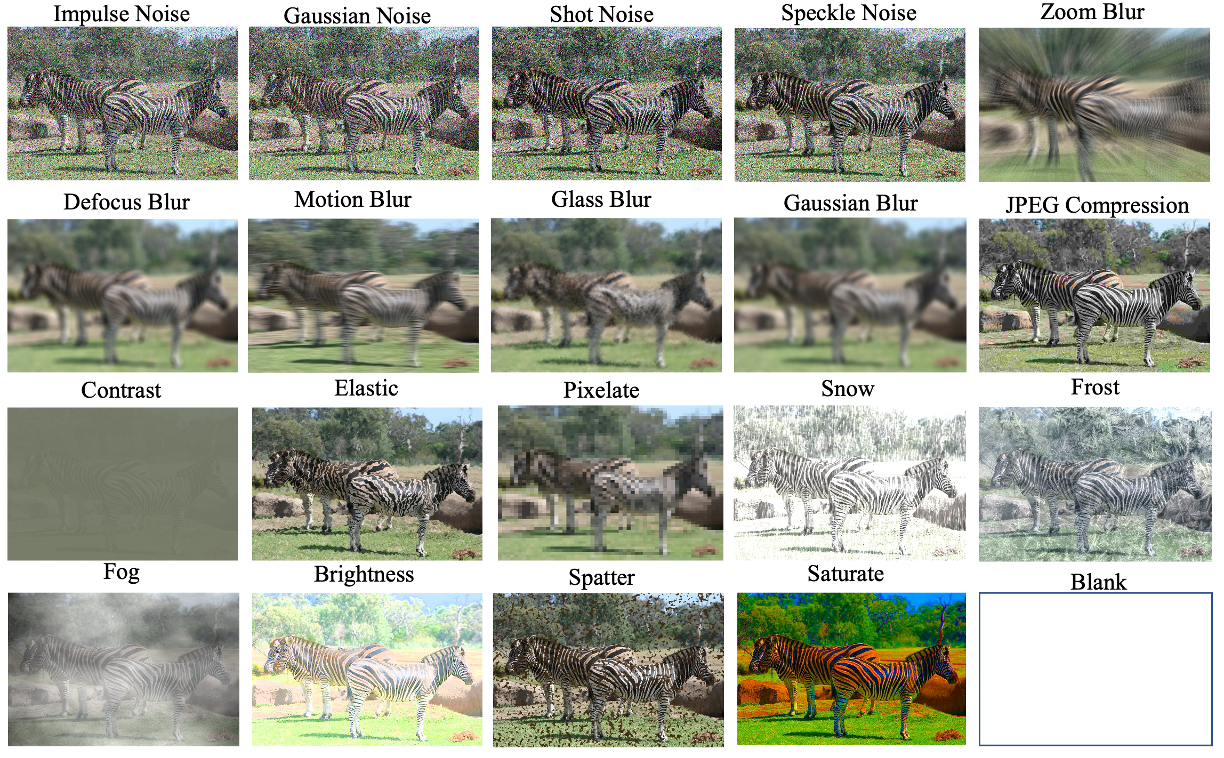
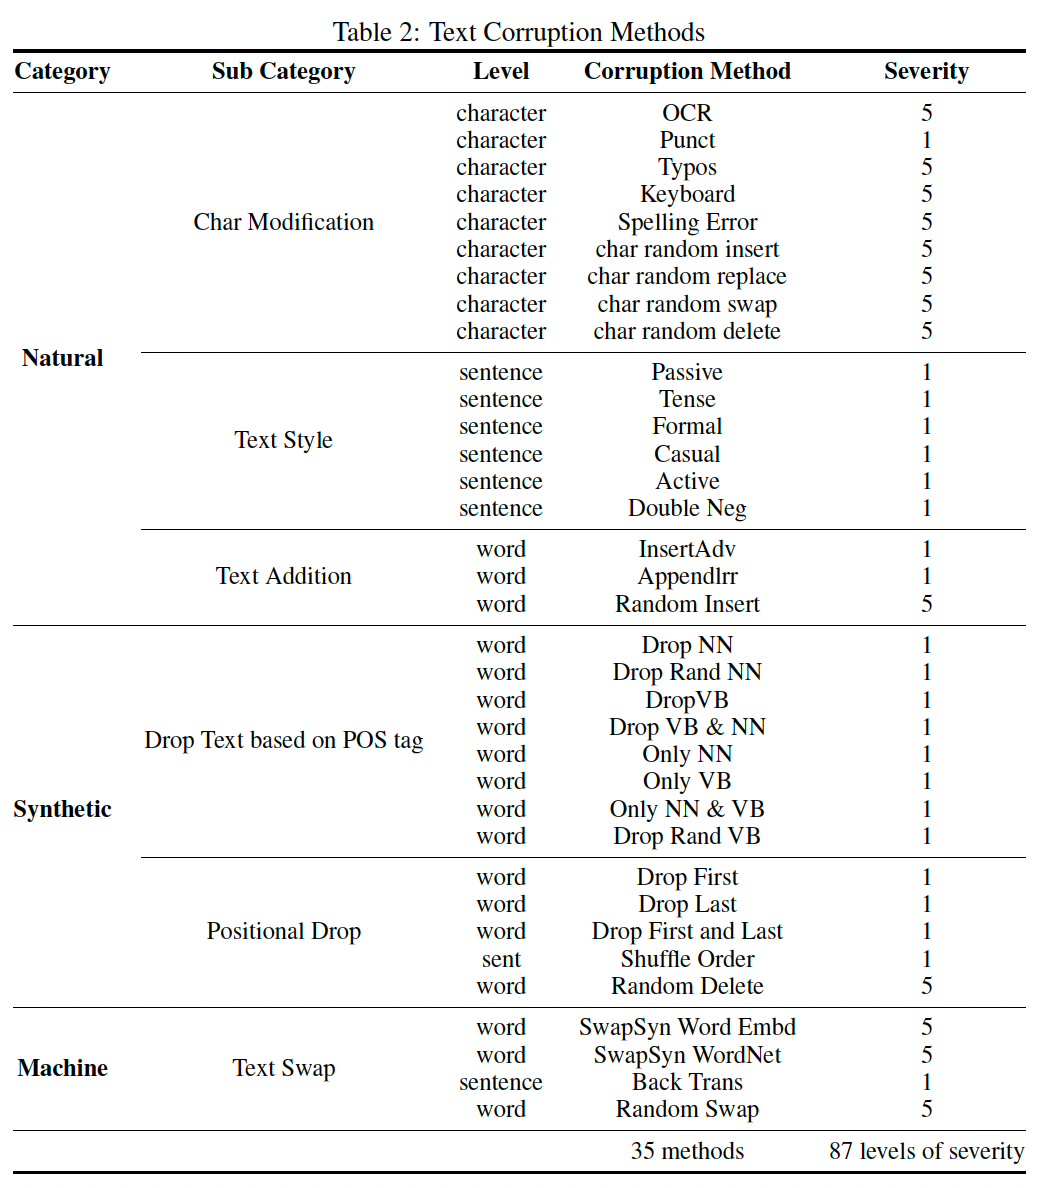
We introduce 20 corruptions to image data. Except for the blank corruption, each type of corruption has five levels of severity. In total, there are 96 different corruptions. We have adopted a total of 35 corruption methods which can be grouped into three categories: character-level, word-level, and sentence-level based on the level of corruption. We have also introduced various severity levels for text corruptions, as we have done for image corruptions. For character-level corruptions and some word-level corruptions, we apply five severity levels. However, for sentence-level corruptions and some word-level corruptions, only one perturbation is available. In total, we have 35 corruption methods along with 87 different perturbations.
Experimental Settings

Accuracy on the Karpathy-test split is evaluated for VQAv2. For GQA, accuracy on the test-dev split is evaluated, and accuracy on the test-P split is used for NLVR$^2$. In image captioning, we use CIDEr on the Karpathy-test split.
Results and Analysis
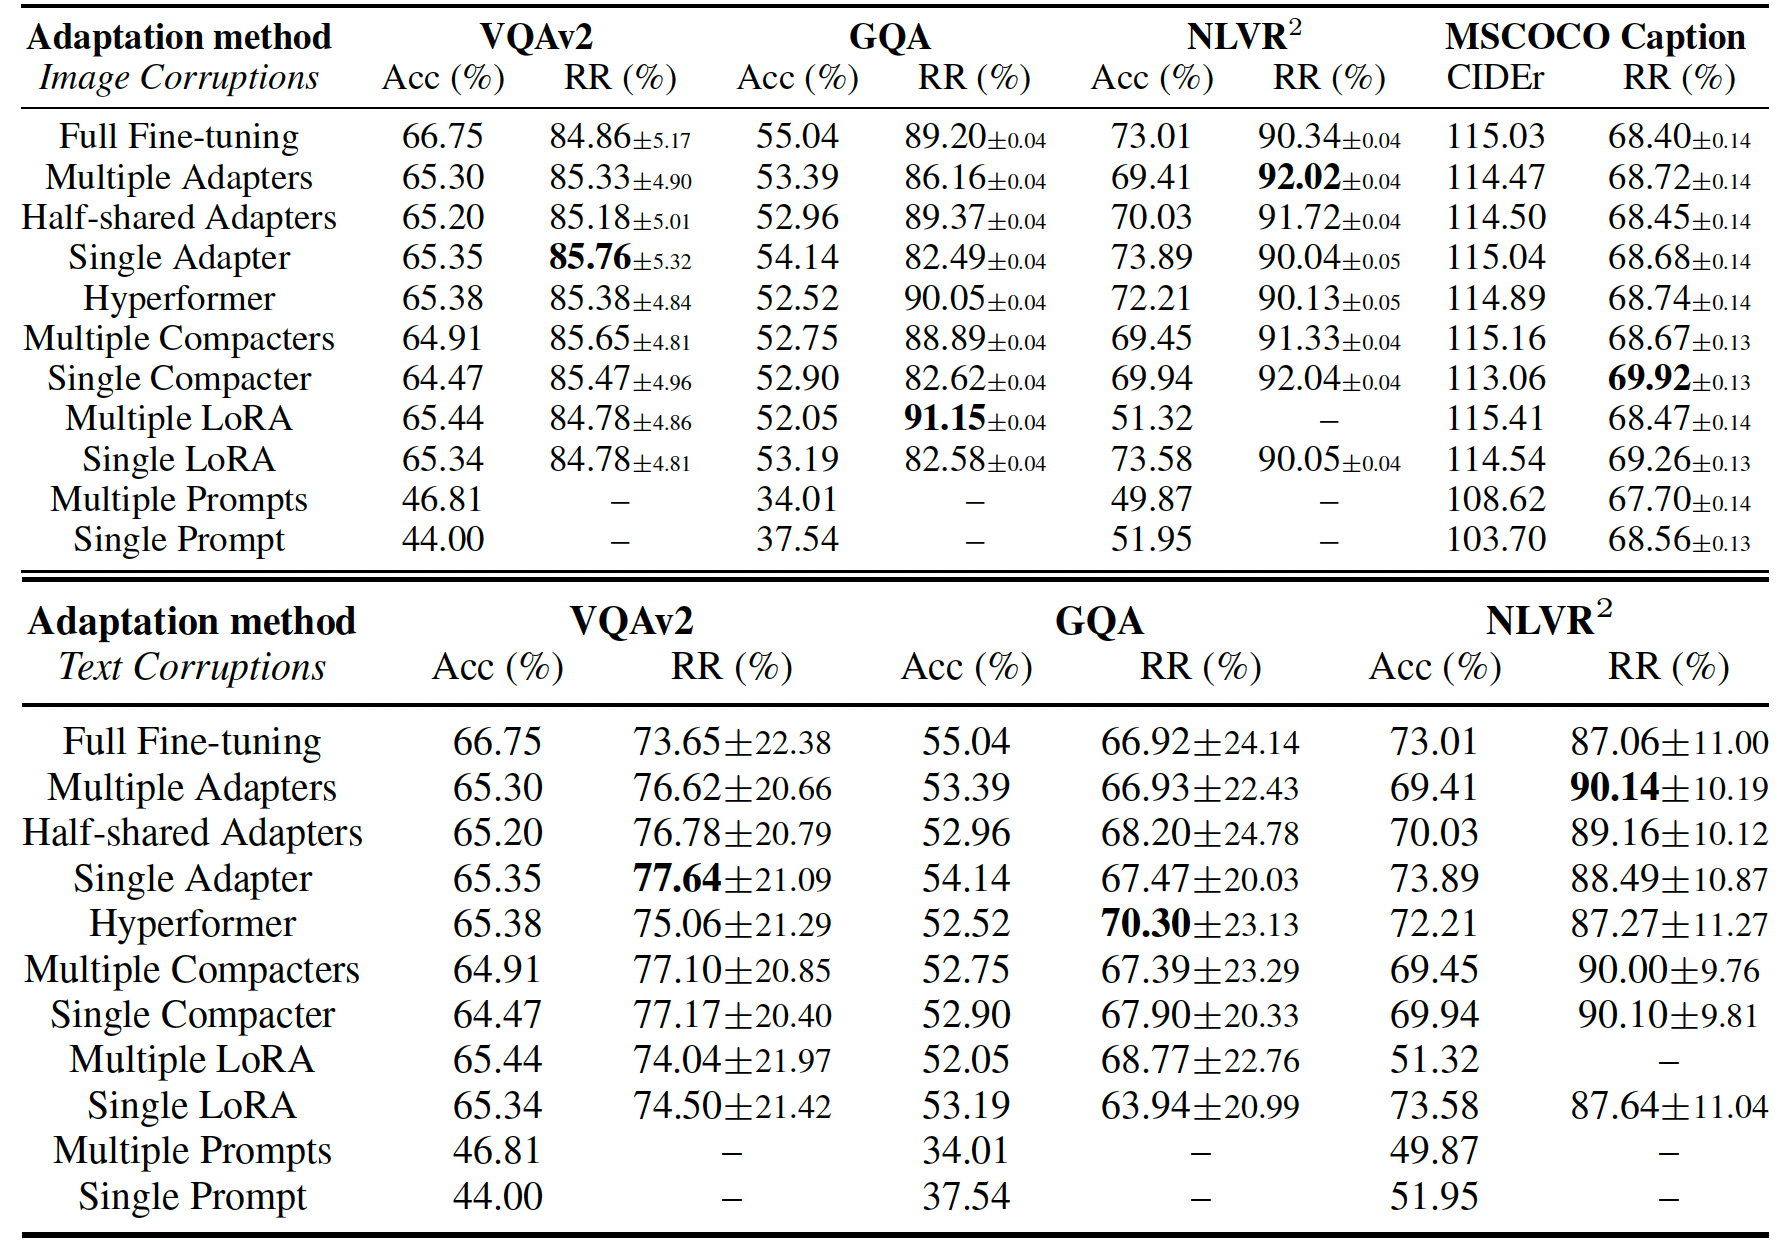
Clean performance and relative robustness (RR) of adaptation methods based on CLIP-BART against image (up) and text (down) corruptions. RR and the corresponding standard deviation is averaged and calculated over all image or text corruption methods. We strike out those high RR with quite low performance. Best RR for each column is in bold.
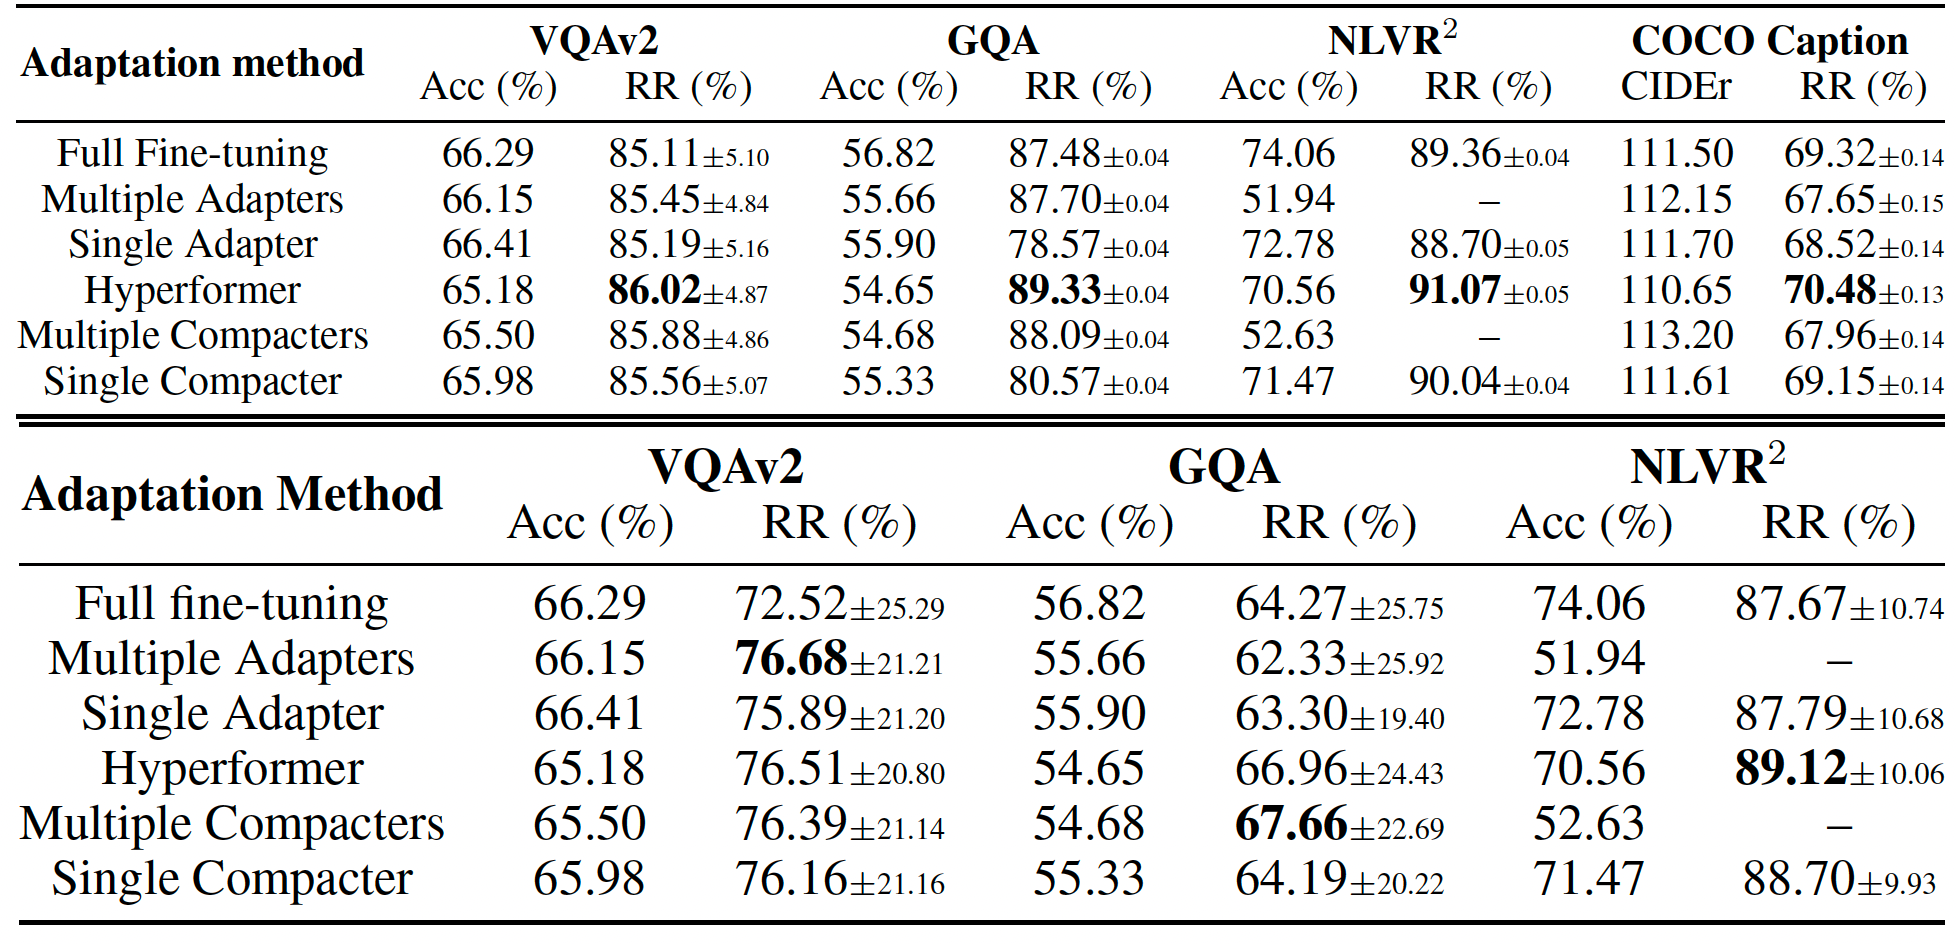
RR(%) of adaptation methods based on CLIP-BART and CLIP-T5 against image (up) and text (down) corruptions with severity 5. The better relative robustness values for each comparison pair are in bold.
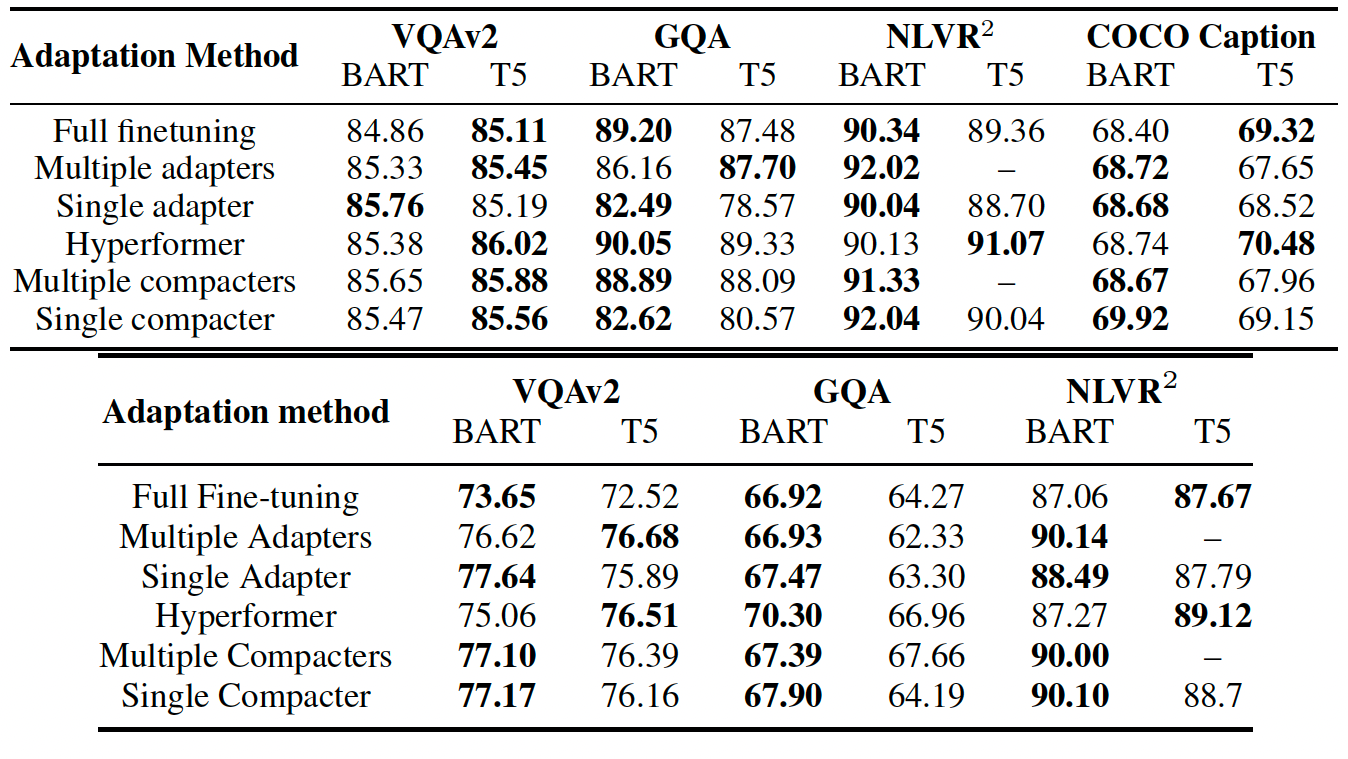
RR(%) of adaptation methods based on CLIP-BART and CLIP-T5 against image (up) and text (down) corruptions with severity 5. The better relative robustness values for each comparison pair are in bold.

Relative robustness (%) of adaptation methods based on CLIP-BART (left) and CLIP-T5 (middle) against blank corruption. We group MSCOCO Caption results from CLIP-BART and CLIP-T5 together in the right sub-figure. We omit two bars in NLVR$^2$ from the middle figure as multiple adapters and multiple compacters did not perform well.

The first row represents the clean performance and relative robustness of full fine-tuning and single adapter on CLIP-BART given different size of adaptation dataset. Green lines stand for performance in each task and the orange is robustness.The second row is relative robustness given different size of adaptation dataset. X-axis shows the random subset ratio of training dataset during adaptation, ranging from 20% to 100%.

Performance and relative robustness of full-finetuning and single adapter on CLIP-BART given different size of adaptation dataset. The first row shows results given image corruptions and the second is from text corruptions. Green lines stand for performance in each task and the blue is robustness.
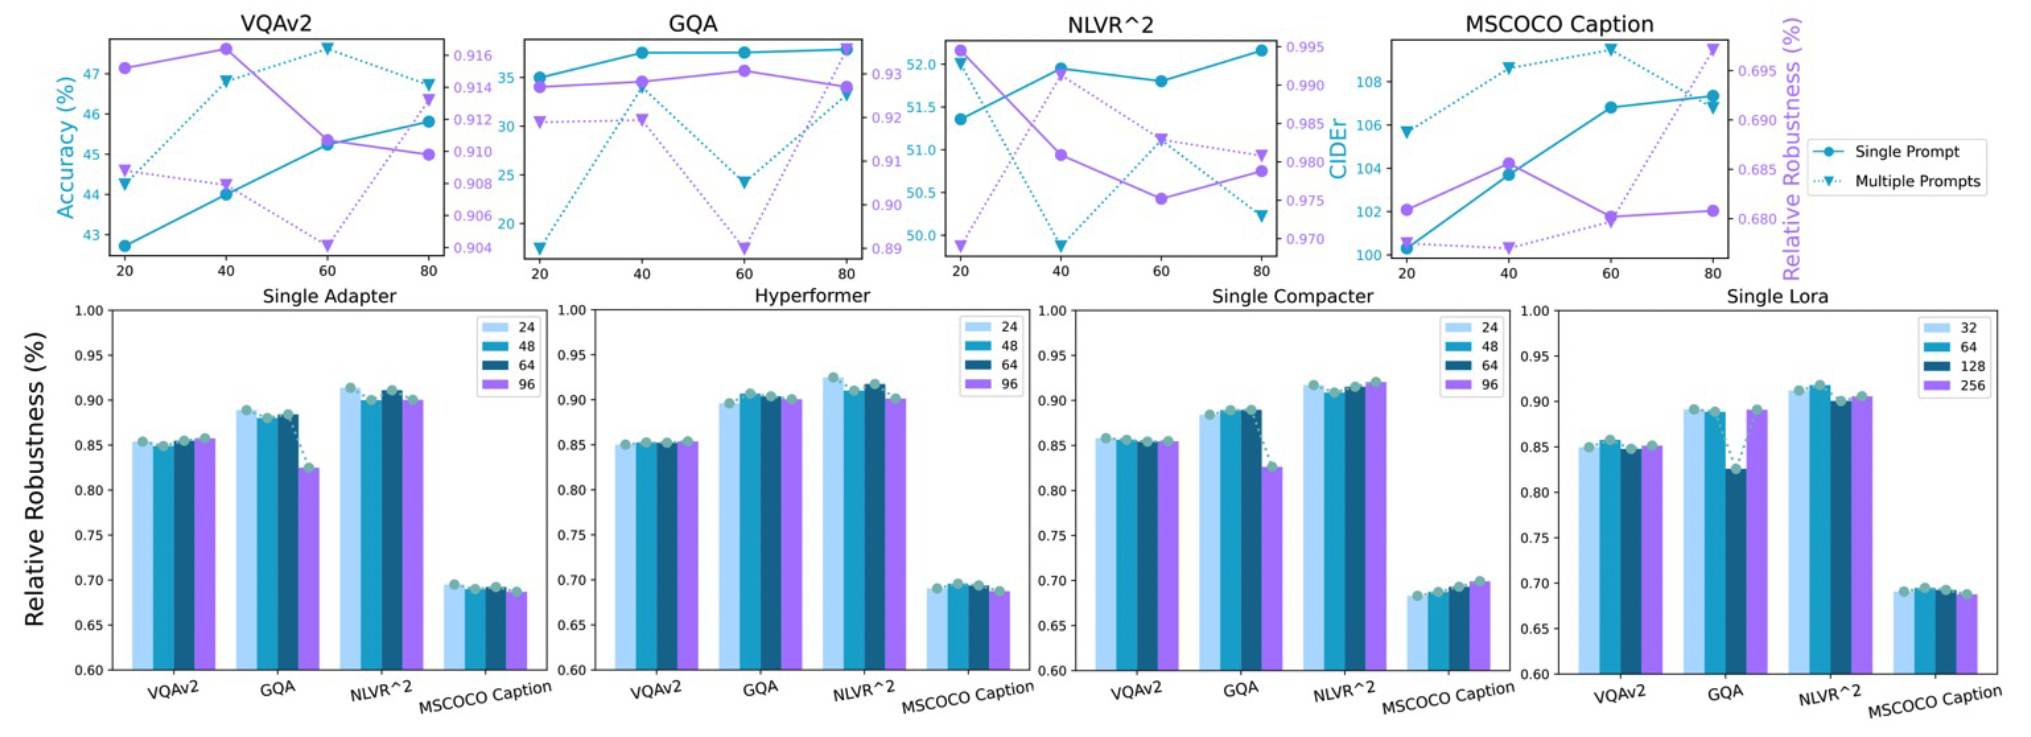
The top row shows the clean performance and relative robustness from prompt adaptations with different prompt length on CLIP-BART. Blue lines stand for performance on each task and purple lines represent relative robustness. The bottom row shows the relative robustness given different number of parameters in 4 adaptation methods. Different colors stand for different embedding size and larger numbers are with more parameters.